Tracking Sleep Latency and Morning Energy Over Time
Spending eight hours in bed can still leave you drained if ninety of those minutes went to staring at the ceiling or waking repeatedly before dawn. Tracking sleep latency in minutes alongside a 1-to-10 morning energy scale separates time in bed from genuine recovery. Plotting both numbers across a month exposes patterns that bedtime alone hides.
Why bedtime-to-alarm duration misleads light sleepers
If you turn off the lamp at eleven and wake at seven, a basic log records eight hours. Yet a night where you fell asleep in ten minutes feels completely different from a night where your mind raced until midnight and woke three times after four.
Sleep latency — how many minutes it took to fall asleep — captures wind-down friction directly, while morning energy measures how restored you actually feel before caffeine masks the fatigue.
- Sleep latency logged in minutes with a one-line reading as you choose.
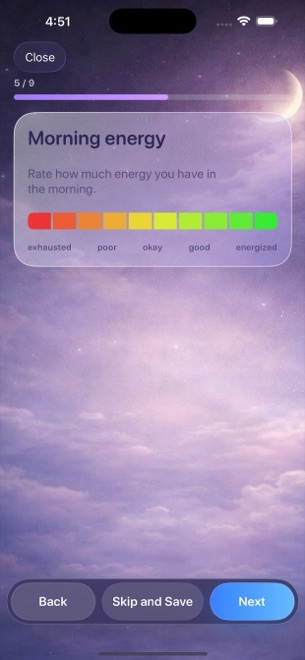
- Morning energy rated across ten segments from exhausted to energised.
- Sleep quality rated separately across ten stars from terrible to amazing.
Rate sleep quality and morning energy as distinct signals
Solid sleep quality and high morning energy often move together, yet splitting them catches subtle mismatches. You might sleep deeply without waking once (eight stars) and still wake groggy because an early alarm cut your sleep window short (four energy segments).
In Dreams Calendar, each point on the 1-to-10 scales displays a short descriptive phrase while you pick it, keeping your ratings steady from week to week without overthinking.
- Log your Night Dream entry within the first few minutes of waking, before coffee changes how alert you feel.
- Enter when you tried to sleep and when you woke up so duration is calculated consistently.
- Estimate sleep latency in rough five- or ten-minute steps rather than watching the clock overnight.
- Pick your 1-to-10 sleep quality stars and 1-to-10 morning energy segments independently.
Compare latency, duration, and energy in Statistics
Once you have two weeks of entries, open Statistics and compare the Sleep Latency, Sleep Duration, Awakenings, and Morning Energy charts over the same date filter. Dragging your finger across any chart reveals exact point values along the timeline.
For many light sleepers, morning energy tracks latency and awakenings far more closely than total time in bed — showing, for example, that going to bed forty minutes later when genuinely sleepy beats lying awake early.
Treat numbers as personal notes, not a scorecard
Turning morning ratings into a perfectionist test defeats the purpose of noticing your rhythm. Everyone logs the occasional twenty-five-minute latency night or low-energy Monday after travel.
Use the monthly and yearly views to spot broad multi-week shifts rather than reacting to a single poor rating, and talk with a doctor if long sleep latency or daytime exhaustion becomes an ongoing health concern.
How should I log sleep latency without looking at the clock in bed?
Use a calm morning estimate — such as 10, 20, or 45 minutes — based on how long winding down felt; consistent estimates show trends without causing clock anxiety.
Why log both sleep quality and morning energy?
Sleep quality reflects how smoothly the night went, while morning energy reflects how rested you feel waking up; short but deep sleep can score high on one and low on the other.
Can I filter latency and energy charts to a custom date range?
Yes. Every chart in Statistics can be filtered by month, year, a custom date range, or all time.