How to Read Sleep Quality and Emotion Chart Patterns
A single rough night or one bizarre dream rarely means anything on its own, yet human memory loves turning two bad Tuesdays into a dramatic theory. Charts earn their keep by cooling down snap judgments and showing what actually repeated across thirty or ninety days. Dreams Calendar turns your entries into ten interactive Swift Charts you can filter and inspect on your device.
Wait for enough entries before drawing conclusions
During your first three or four mornings with a sleep and dream log, every chart moves sharply whenever one rating changes. Treating a four-day dip as a permanent pattern usually leads to unnecessary worry.
Give your calendar at least two to four weeks of ordinary, imperfect logging first. Once fifteen or twenty nights sit on the graph, genuine shifts stand out clearly from an isolated late dinner or noisy hotel room.
Know what each group of the ten charts measures
Rather than merging everything into a mysterious wellness percentage, the Statistics view breaks your logs into ten readable charts grouped around sleep mechanics, emotional tone, and dream frequency.
Every chart reflects strictly what you entered yourself, computed locally on your iPhone or iPad with zero server analytics.
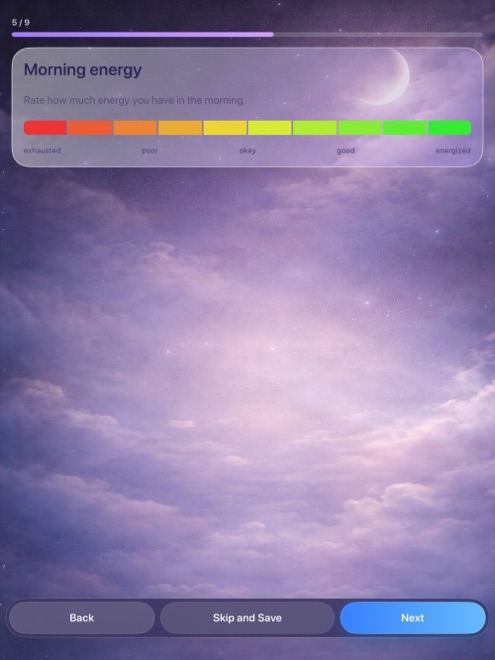
- Five sleep trend charts: average sleep quality, duration, sleep latency, awakenings, and morning energy.
- Two emotion frequency charts: most common positive emotions and most common negative emotions.
- Two activity count charts: dream logs per week and nightmares per day.
- One correlation view: sleep quality plotted against emotion balance (positive minus negative chips).
Review your month with a structured four-step pass
Looking at ten charts at once is easier when you move from broad time filters down to specific outlier days. Built-in range controls let you switch between a single month, a full year, a custom date window, or all time.
Dragging your finger across a chart highlights individual points so you can see exact dates and values before jumping back to Day or Multi-day view to read what you wrote.
- Set the filter to the past month first so recent travel, work deadlines, or schedule changes are still easy to recall.
- Compare Sleep Duration against Sleep Quality and Morning Energy to see whether longer nights actually felt better.
- Check the Sleep Quality versus Emotion Balance scatter plot to see whether heavily negative emotion sets cluster around low-star sleep.
- Drag to inspect any extreme high or low point, note the date, and open that day on the calendar to read the dream or reflection behind the number.
Keep correlation separate from medical diagnosis
Even when the scatter plot shows poorer sleep quality alongside negative emotion balance, a chart cannot tell you which direction the arrow points. Poor sleep makes the next evening feel harder to handle, just as a stressful week makes nights lighter and dreams tenser.
Treat the patterns you spot as practical prompts for everyday experiments — such as protecting an earlier wind-down hour — rather than clinical verdicts. Nothing in Dreams Calendar is medical or psychological advice, and persistent sleep or mood difficulties belong with a professional.
Compare seasonal windows with custom date filters
Switching a chart from a thirty-day view to a full-year or custom range often explains shifts that looked mysterious up close. Daylight changes, exam periods, summer heat, or heavy travel months stand out immediately when you zoom out.
Use Year view alongside the Statistics tab at the end of each quarter to see both how consistently you logged and which calm routines coincided with your highest-rated mornings.
How many charts are included in the free Dreams Calendar app?
All ten Swift Charts are included for free with no subscription or in-app purchases.
Can I inspect an exact day on a chart in Statistics?
Yes. Filter by month, year, custom range, or all time, and drag across the chart to inspect individual points.
What does emotion balance on the scatter plot mean?
It equals the number of positive emotion chips minus negative emotion chips logged, plotted alongside your 1-to-10 sleep quality rating.